Reflecting on current progress
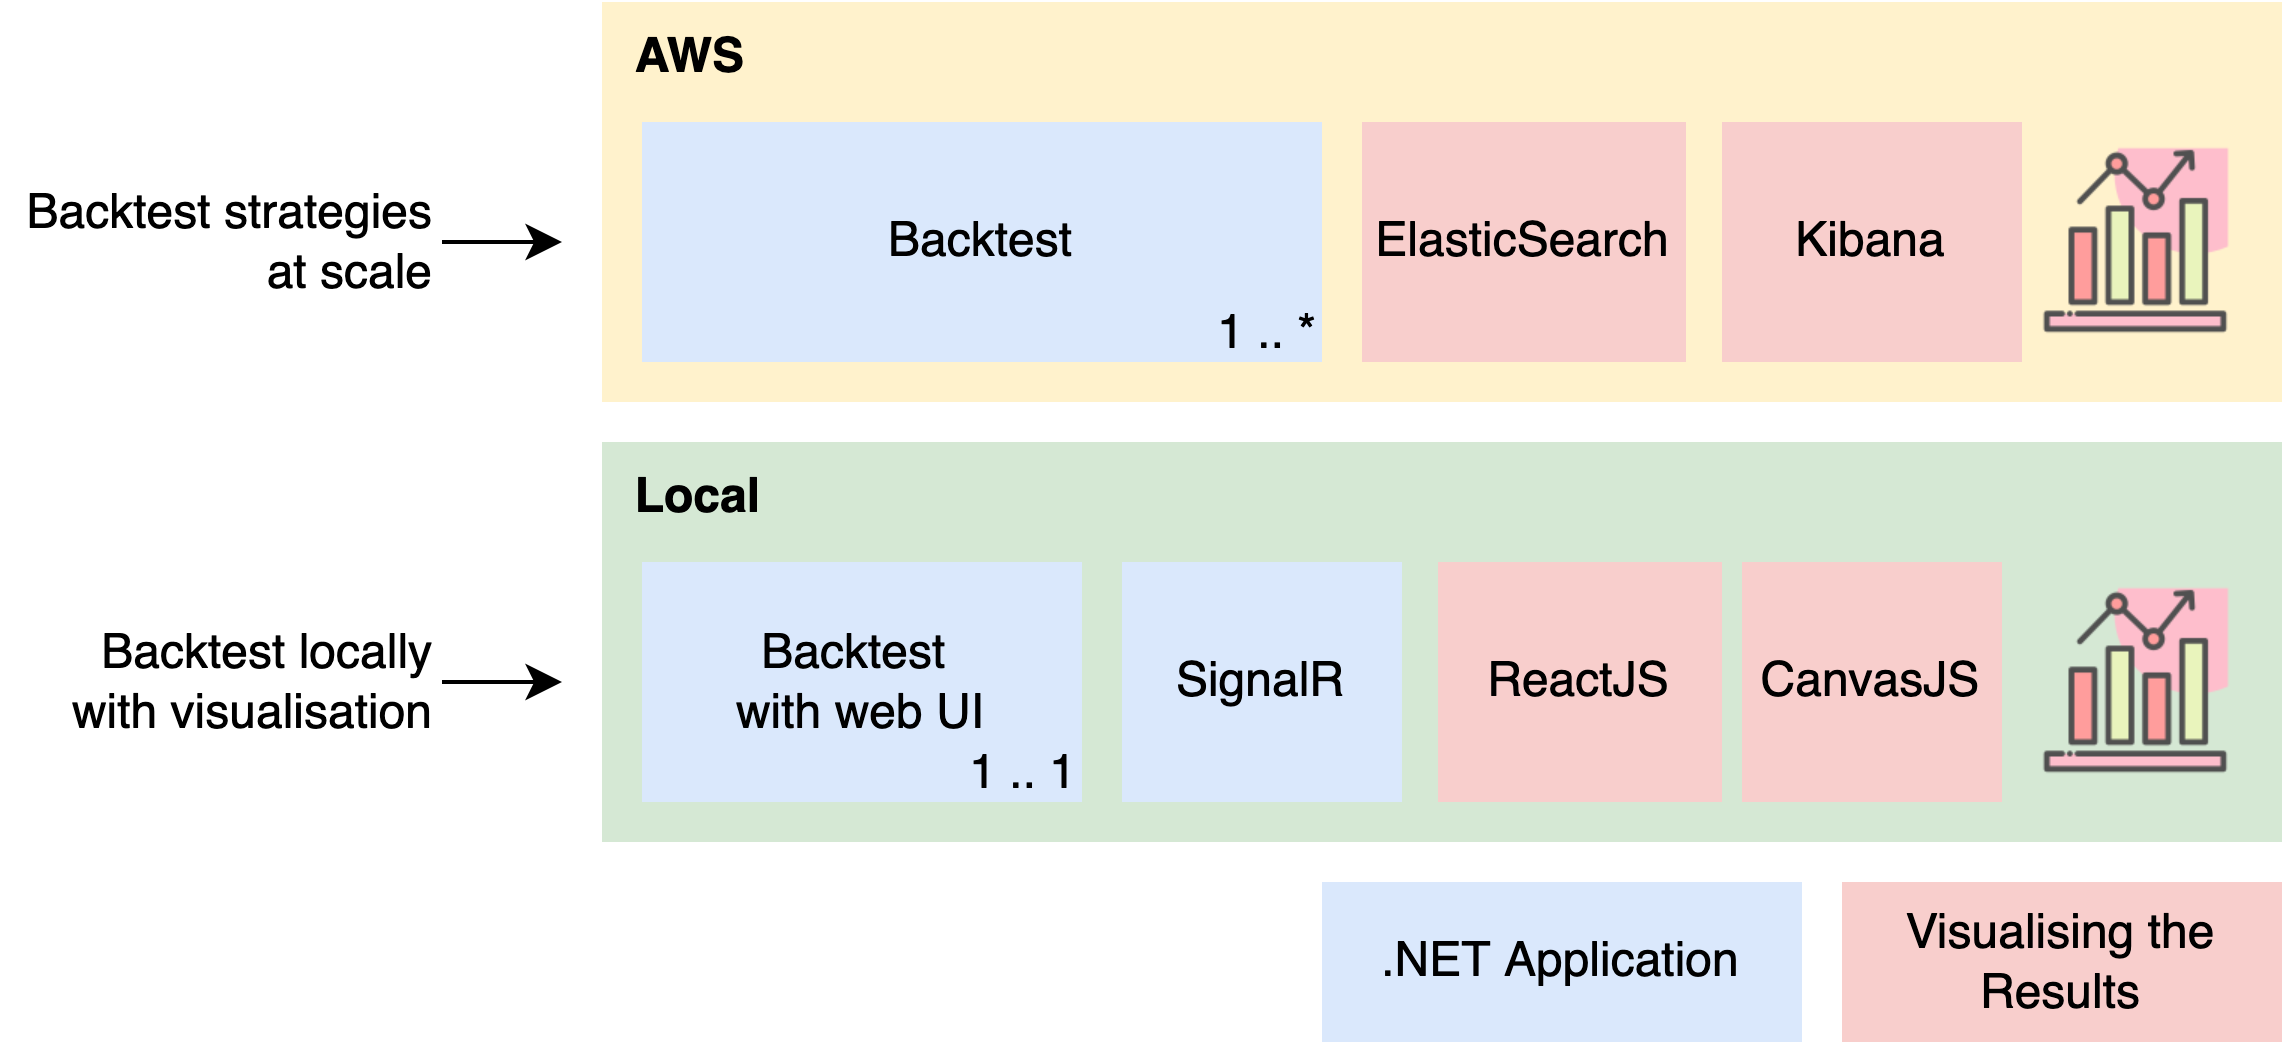
Over the last couple of months, I have designed and developed a Backtesting Engine from scratch to experiment with trading strategies at scale on AWS.
I’ve experimented with Random Trading Strategies and performed some light Market Analysis using ElasticSearch and Kibana.
The Backtesting Engine has realistic trading execution, efficient order flow, and account management. There are also good engineering practices such as unit testing, error catching, and observability.
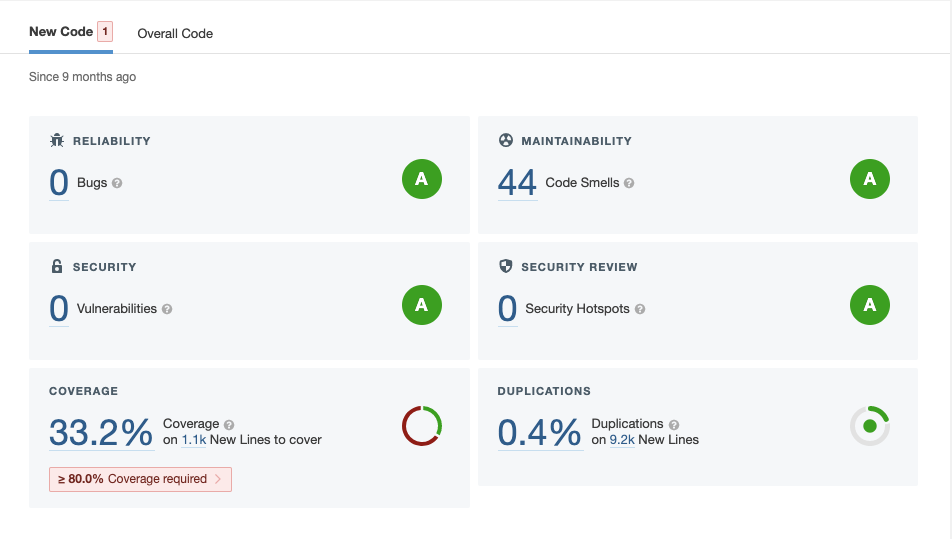
I’m continuously improving the codebase with unit tests to ensure that trade execution is accurate and realistic as I make changes. The codebase currently has 33% test coverage (Taken 28th August 2022). The static code analysis is public on SonarCloud.
The design of the Backtesting Engine enables flexibility, but I have found it difficult to move on to the next step, Systematically Trading, and developing strategies with rapid iteration.
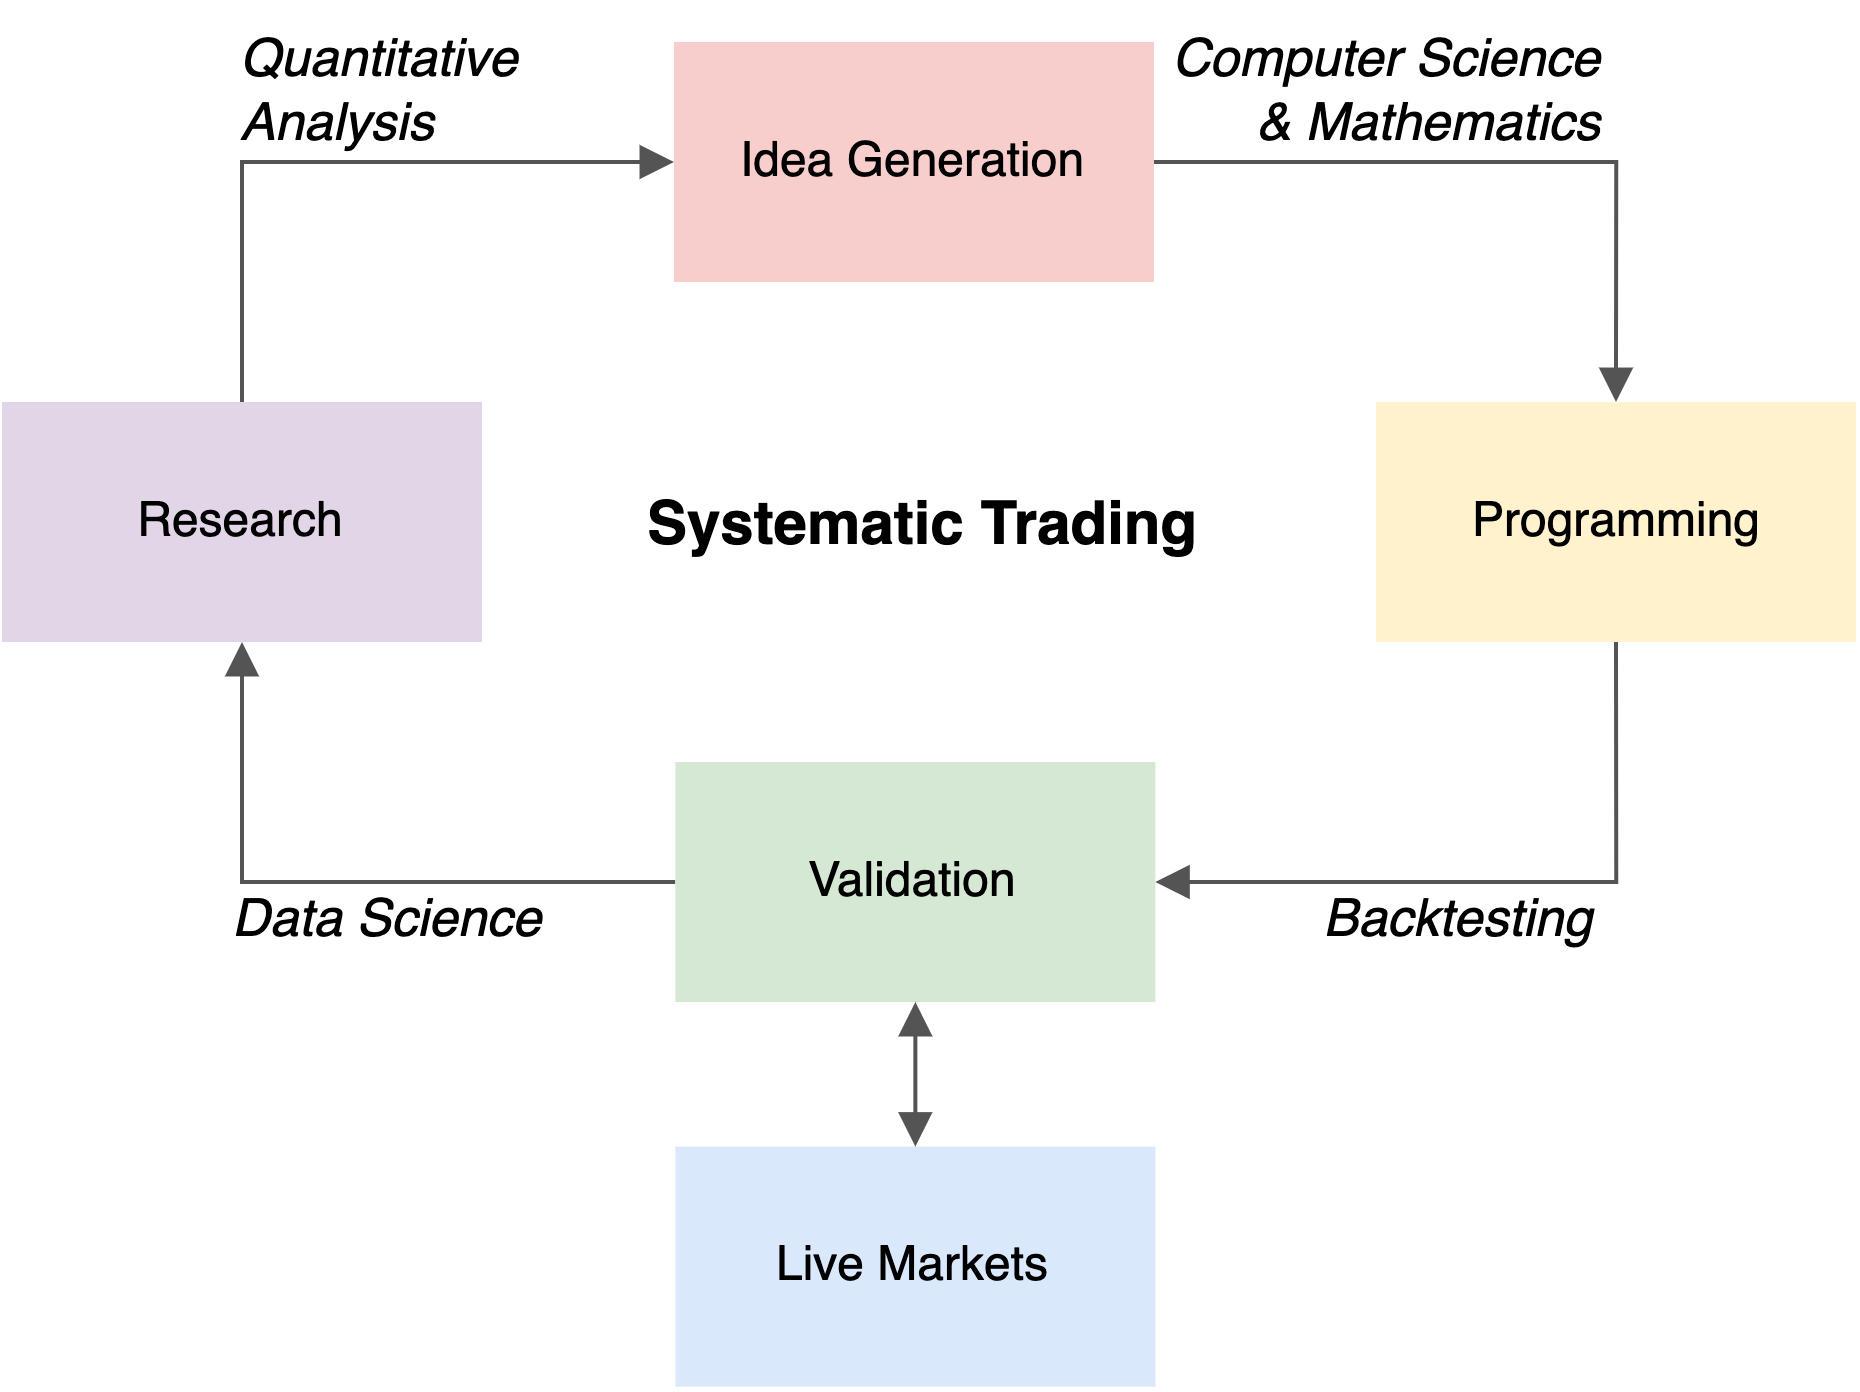
Systematically Trading
Systematically trading, which consists of research, idea generation, programming, and backtesting, is hard. It’s a field combining Quantitative Analysis, Computer Science, Mathematics, and Data Science.
To be more efficient I have developed a User Interface for local backtesting to visualise trading data and strategy rules.
The Backtesting Engine combines tick data into OHLC (Open, High, Low, Close) objects to be rendered in a chart, and overlays trading activity (Open and Closed trades). SignalR is used to transport messages between the Backtesting Engine and ReactJS, when deployed locally (which is defined as an command line arguement).
As a result, I can quickly develop and experiment with strategies, catching errors faster with less trial and error on AWS, which, aside from the time sink, also saves money.
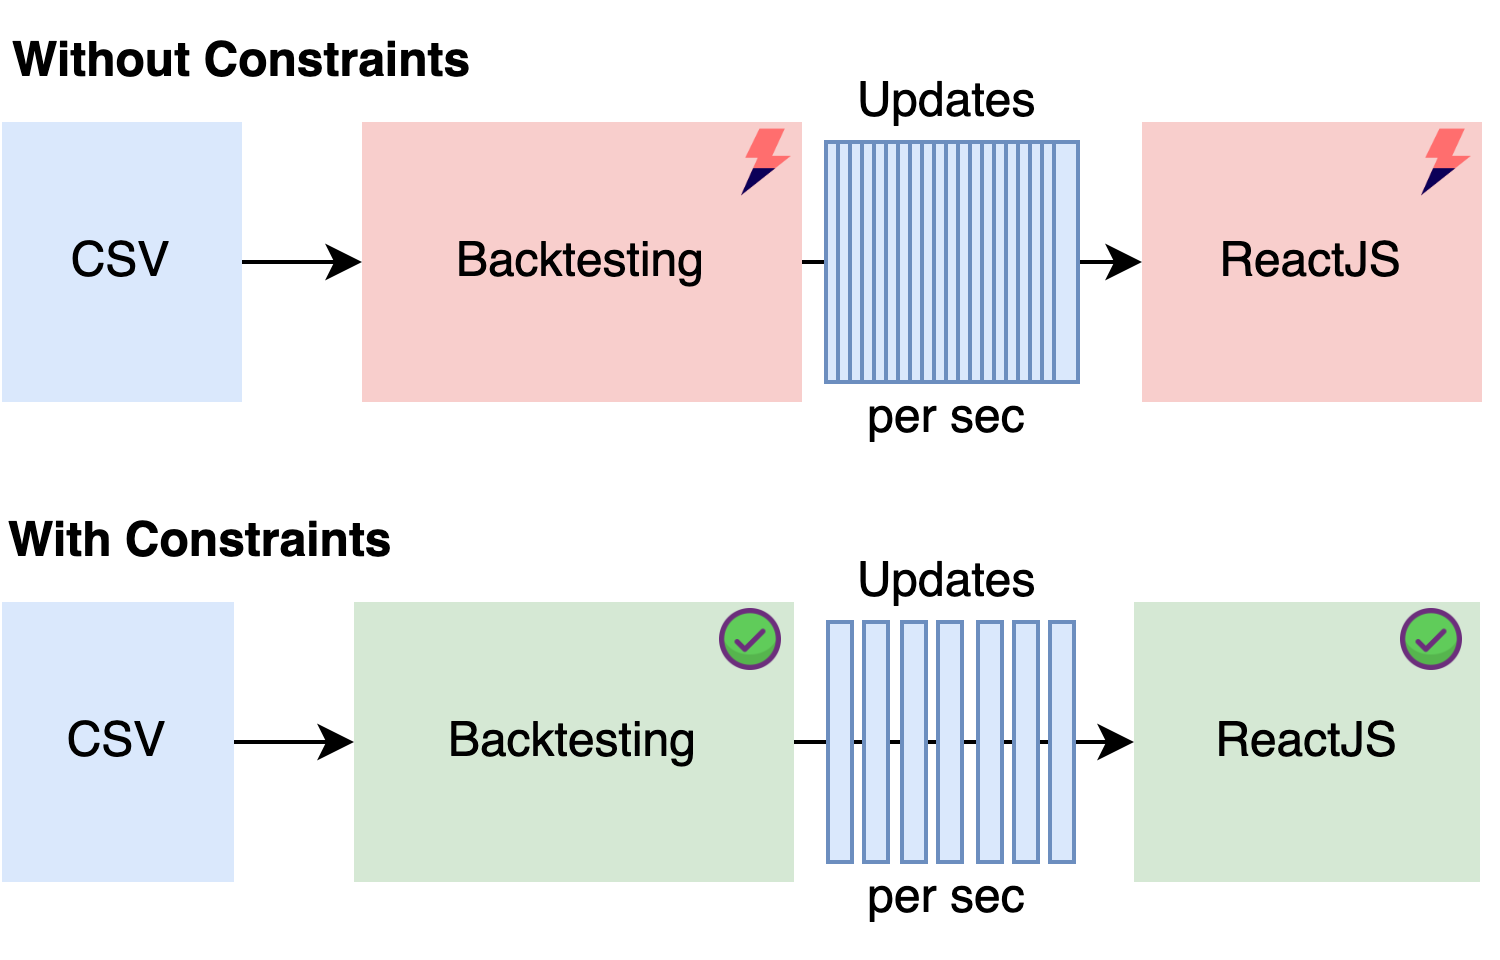
Constraints
I have applied an ingest constraint to ensure a steady stream of trade data to the UI and to visually see the performance of the strategy.
This constraint reduces the ingest speed, and as a result, it means a longer processing time, although it is still relatively fast, compared to real life. It’s also configurable and depends on the timeframe of the OHLC object. This means there are various configurations for the Backtesting Engine, as described below.
| Deployment Type | Time span | Speed | Scale |
| AWS | Multiple Years | EC2 Instance Size | Multiple Symbols |
| Locally | Months to Years | Local Resources | Multiple Symbols |
| Locally with Web UI | Days to Months | Local Resources | One Symbol |
OHLC Representation
An OHLC Object is a useful representation of trading data as it encompasses 4 points of reference over a time period into a single bar. It shows the open, high, low, and closing price for a period, visualising price movement.

The OHLC representation can be applied to any timeframe, and as an example, if applied to a 1 hour time frame, it will contain the highest and lowest values, alongside the opening value and the close value. In this in example, over the course of a day you can visually see the price change, and gives the user more informatino over a traditional line chart.

There are several ways to intepret a OHLC Candle, based on the height of the bar and how large the lines are from the bar (which could indicate a reversal or strong support/resistance). There are also candlestick patterns that indicate trade exhaustion and breakwaways that I would like to test in the near future.
Software
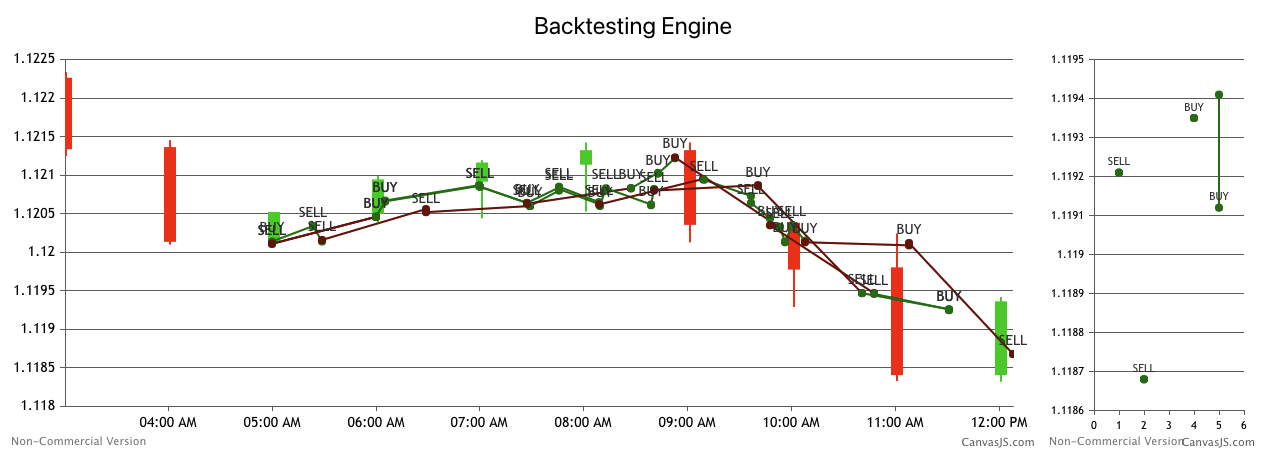
As previousily mentioned, the UI is displaying OHLC data as candlesticks in the chart, with annotations for displaying open and closed trades (shown below). These annotations can be extended further to show levels of interest from the strategy.
I have added SignalR as a service to enable communication between the Backtesting Engine and the UI.
SignalR is a free and open-source software library for Microsoft ASP.NET that allows server code to send asynchronous notifications to client-side web applications. The library includes server-side and client-side JavaScript components.
SignalR takes advantage of several transports, automatically selecting the best available transport given the client’s and server’s capabilities. SignalR takes advantage of WebSocket, an HTML5 API that enables bi-directional communication between the browser and server.
I’ve created a wrapped SignalR class and an interface to enable this to be injected into the existing Backtesting Engine, to transform and pass messages to the UI. On the UI side I’ve created a ReactJS application with CanvasJS as the charting framework to render the candlesticks and other trading data.
CanvasJS is a HTML5 and Javascript Charting library with high performance. https://canvasjs.com/docs/charts/intro/
AVIF File Format
Just to note, I’m using the AVIF format to display video screen captures of the backtesting engine. You will see a static image above if your OS/Browser does not support AVIF yet. Chrome and Firefox has full support, with limited support in Safari, and no support in Edge at the time of writing (August 2022).
AVIF is modern image format based on the AV1 video format. AVIF generally has better compression than WebP, JPEG, PNG and GIF and is designed to supersede them. https://en.wikipedia.org/wiki/AVIF
Implementation
I’ve added SignalR to the Backtesting Engine as a new project and created a wrapper that takes in Models from the Backtesting Engine. This wrapper is injected via the existing dependency injection process on startup if a command line arguement has been defined.
To elaborate further, the entry point of the application, the main() method has a condition to check if the arguments are higher than 0 and whether they have a reference to web. I’ve kept it simple and used a string to trigger the SignalR classes to be injected.
The sequence of events:
- If
webhas been defined as command line arguement - Deploy the Signalr web host
- Inject the
IWebNotificationclass - Wait 5 second
Task.Delay(5000)for the SignalR host to start - Continue with Backtesting Engine execution
It’s a fairly simple change, but I’ve created a new deployment script that contains the arguement, which gives me more flexibility in the future to add more to this start up path. All of the environment variables are pulled in both scripts, so I don’t have to worry about modifying the bash scripts to test out different strategies.
./scripts/backtesting/run.sh- dotnet run –project ./src/backtesting
./scripts/backtesting/web.sh- dotnet run –project ./src/backtesting – web
Alternatively, if the web arguement is not defined, the backtesting engine will continue with the existing flow but inject an EmptyWebNotification so SignalR won’t be invokved. This prevents any performance overhead of deploying a SignalR server and can run at scale on AWS without any impact. The system needs this empty web service as there are references in the trading operatinos to report out open and closed trades.

A small code snippet to demonstrate this (Program.cs):
| |
Too much data
I quickly discovered the backtesting engine was sending too much data to SignalR, and the charting engine in ReactJS. I needed to slow this down to ensure performance and further, so I could also visualisally see how the strategies was performing. I found that my local system would crawl if I sent too many updates a second to be rendered. After all, I can only visually see so much data a second anyway so I worked to reduce this.
I initially added a Task.Delay(1), a 1 millisecond delay on ingest, but that dramatically slowed down the overall backtesting engine to about 1 hour of chart data per 5 seconds.
So I created a condition to compare the system time against the tick event time, and limited the comsumer to only read 1 hour of tick event data every 0.25 second, giving flexibility over the amount of trading data that is consumed in real time. This allowed me to experiment with how much OHLC data is presented.
The condition can be adjusted, and is it’s necessary if you increase the amount of data in the OHLC, as a higher timeframe of OHLC events will need a faster flow of data.
Improving performance
The Backtesting Engine is using SignalR synchronised, so the speed of the backtesting engine is dependant on how fast ReactJS and CanvasJS can present the data. This has some benefits in that the trading engine can not run away and be well out of sync with the data processed and presented, but it also means the whole chain, processing and presentation need to be optimised.
I’ve also added additional constrasts to improve performance:
- The system will not send duplicate
OHLCupdates to the ReactJS - Drops 1/3 updates, force the last complete OHLC candle to be rendered
- Show a maximum of 80 OHLC Candles on the chart at once
- Remove trade and OHLC candles from ReactJS memory once hidden
Visualising Open and Closed trades
The UI can stream data and display OHLC candles, so I added in fuctionality to show open and closed trades.
The screenshot is showing a visualisation of the Random Trading strategy I’ve worked in previously.
More to follow!